The latest statistics released by the Dubai Department of Economy and Tourism revealed that the number of visitors to the emirate reached 7.2 million international visitors during the first four months of 2025, representing a growth rate of approximately 7% compared to the same period in 2024, which recorded around 6.7 million visitors.
According to the department’s report, hotels and hotel apartments achieved an occupancy rate of 83.5% during the first four months of this year, compared to 81.4% during the same period last year.
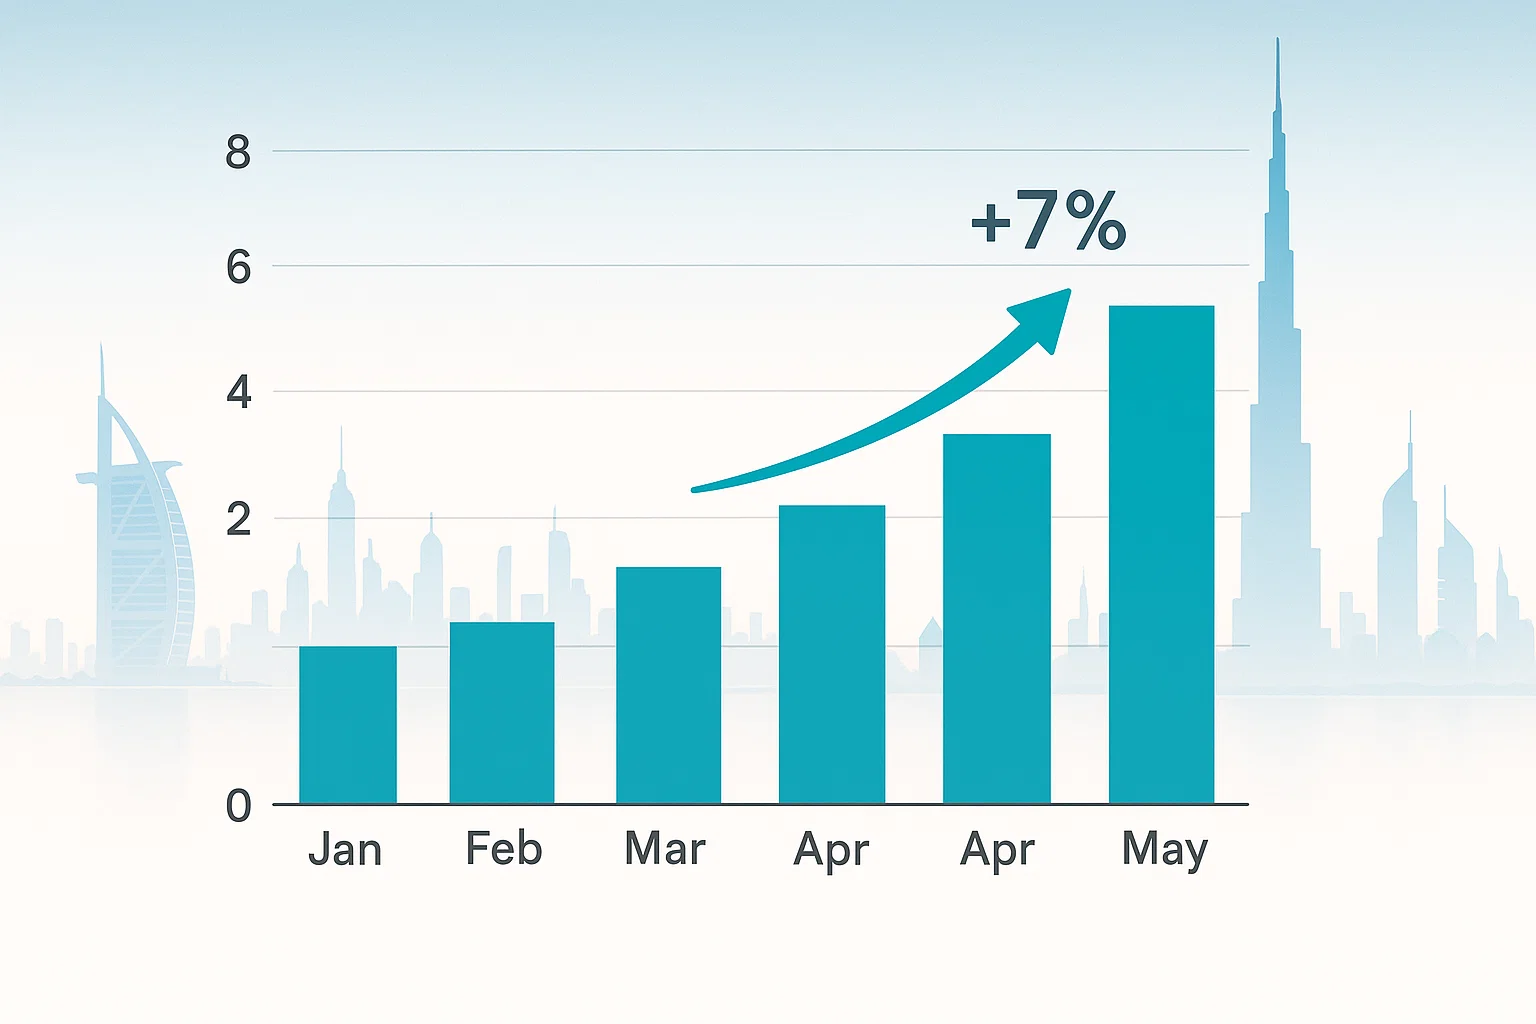
Monthly Visitor Growth to Dubai Since 2024 (in million visitors)
| Month | Visitors 2024 (million) | Visitors 2025 (million) | Change |
|---|---|---|---|
| January | 1.77 | 1.94 | +9.6% |
| February | 1.90 | 1.88 | (–1.1%) |
| March | 1.51 | 1.49 | (–1.3%) |
| April | 1.50 | 1.84 | +22.7% |
| May | 1.44 | — | — |
| June | 1.19 | — | — |
| July | 1.31 | — | — |
| August | 1.31 | — | — |
| September | 1.36 | — | — |
| October | 1.67 | — | — |
| November | 1.83 | — | — |
| December | 1.93 | — | — |
According to the department’s report, Western Europe topped the list of source regions for tourists to Dubai during the first four months of this year, accounting for 22% of total visitors, equivalent to approximately 1.6 million tourists. It was followed by Russia, the CIS countries, and Eastern Europe, with 1.2 million tourists, representing 16% of the total.
Top Tourist Source Regions to Dubai (First Four Months of 2025)
| Region | Number of Visitors (thousand) | % of Total Visitors |
|---|---|---|
| Western Europe | 1,598 | 22% |
| Russia, CIS & Eastern Europe | 1,178 | 16% |
| GCC Countries | 1,037 | 15% |
| South Asia | 1,002 | 14% |
| Middle East & North Africa | 821 | 11% |
| Northeast & Southeast Asia | 626 | 9% |
| The Americas | 497 | 7% |
| Africa | 278 | 4% |
| Australasia | 111 | 2% |